Key findings
- A visibility score is a proportion: the share of sampled AI answers that named you. Its uncertainty follows the same binomial math as any poll.
- With 5 answers, a brand that truly appears half the time scores 1, 2, 3 or 4 out of 5 by chance 94% of the time. Five answers can’t reliably separate 25% visibility from 75%.
- At 15 answers, a reading of 7/15 still carries a 95% range of 25% to 70%.
- To detect a 10-point change between two periods you need roughly 400 answers in each period.
Why one answer is not a measurement
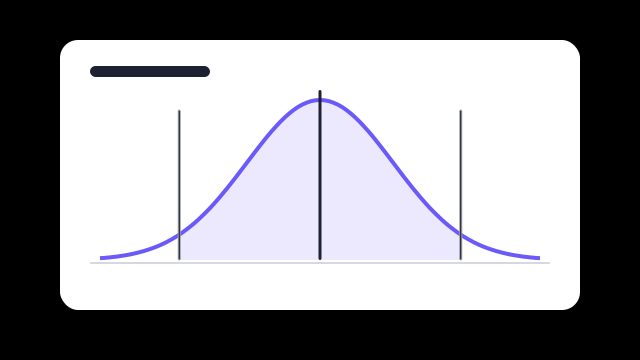
Large language models sample their output. The same question, asked the same way, can name your brand in one answer and leave it out of the next. So “does ChatGPT recommend us?” has no yes-or-no answer; it has a rate. You estimate that rate by asking many times and counting — and like any estimate from a sample, it comes with a margin of error.
How wide the range is at each sample size
Each row shows a brand observed in half of its sampled answers, and the 95% confidence interval for its true visibility (Wilson score interval, which behaves properly at small samples). The last column is the textbook ± margin at 50%, for comparison.
| Answers sampled | Observed | 95% range for true visibility | Simple margin |
|---|
| 5 | 2 of 5 (40%) | 12%–77% | ±44 pts |
| 10 | 5 of 10 (50%) | 24%–76% | ±31 pts |
| 15 | 7 of 15 (47%) | 25%–70% | ±25 pts |
| 25 | 12 of 25 (48%) | 30%–67% | ±20 pts |
| 50 | 25 of 50 (50%) | 37%–63% | ±14 pts |
| 100 | 50 of 100 (50%) | 40%–60% | ±10 pts |
| 200 | 100 of 200 (50%) | 43%–57% | ±7 pts |
| 400 | 200 of 400 (50%) | 45%–55% | ±5 pts |
What five answers can and can’t tell you
Five answers is a common size for a quick check — including our own free check. If a brand’s true visibility is exactly 50%, these are the odds of each score:
| Score | 0/5 | 1/5 | 2/5 | 3/5 | 4/5 | 5/5 |
|---|
| Probability | 3.1% | 15.6% | 31.2% | 31.2% | 15.6% | 3.1% |
A five-answer check is good at one thing: telling you whether you appear at all. If you score 0/5, your true visibility is probably low (the 95% upper bound is 43%). It is not good at telling 40% from 60%, or this week from last.
Detecting change over time
Comparing two periods is harder than measuring one, because both readings are noisy. The table gives the smallest change you could reliably detect (80% power, 5% significance, around 50% visibility) with the same number of answers in each period.
| Answers per period | Smallest detectable change |
|---|
| 5 | 89 pts |
| 15 | 51 pts |
| 25 | 40 pts |
| 50 | 28 pts |
| 100 | 20 pts |
| 200 | 14 pts |
| 400 | 10 pts |
So a dashboard that reports “+8 points this week” from 25 answers a week is mostly reporting noise. Trend lines over many weeks, or pooled across many questions, are far more trustworthy than any single week-over-week delta.
Answers are not fully independent
The math above assumes every answer is an independent draw. They aren’t quite: repeated answers to the same question are correlated, so 5 questions asked 3 times each carries less information than 15 different questions. Spread your sample across many distinct buyer questions rather than repeating a few, and treat the ranges above as the best case.
Practical rules
- Use small samples to answer “are we in the conversation at all?”, not “did we gain 5 points?”.
- Report a range, or at least the sample size, next to every visibility score.
- Judge trends over several periods, and pool across questions and models before reading a change.
- Ask many different buyer questions instead of repeating one. Our buyer question generator helps build the list.
Our tracked keywords ask each of five frozen questions three times per run for exactly this reason, and our methodology shows the sample behind every number. For the formulas behind the metrics themselves, see how to calculate AI share of voice.
Cite this
You are welcome to quote and chart these figures with a link back. Suggested citation: Mentioned, “How Many AI Answers Do You Need to Measure Visibility? The Margin-of-Error Math,” October 25, 2026, https://mentioned.at/learn/ai-visibility-margin-of-error. Data and text are published under CC BY 4.0.
Run a free check